Managed service providers have a metric ton of information that they capture.
Think about just the data that comes from remote monitoring and management (RMM) agents. Then, add in backup data, security scans, dark web reports, budgeting spreadsheets, ticket statistics, and…
You get the idea. It’s a lot.
To make matters complex, most of that information is raw – tabulated, unrefined, and sometimes straight-up ugly.
While that doesn’t matter too much for the technicians managing the data, it’s a nightmare for account managers that have to report it back to the client as a report.
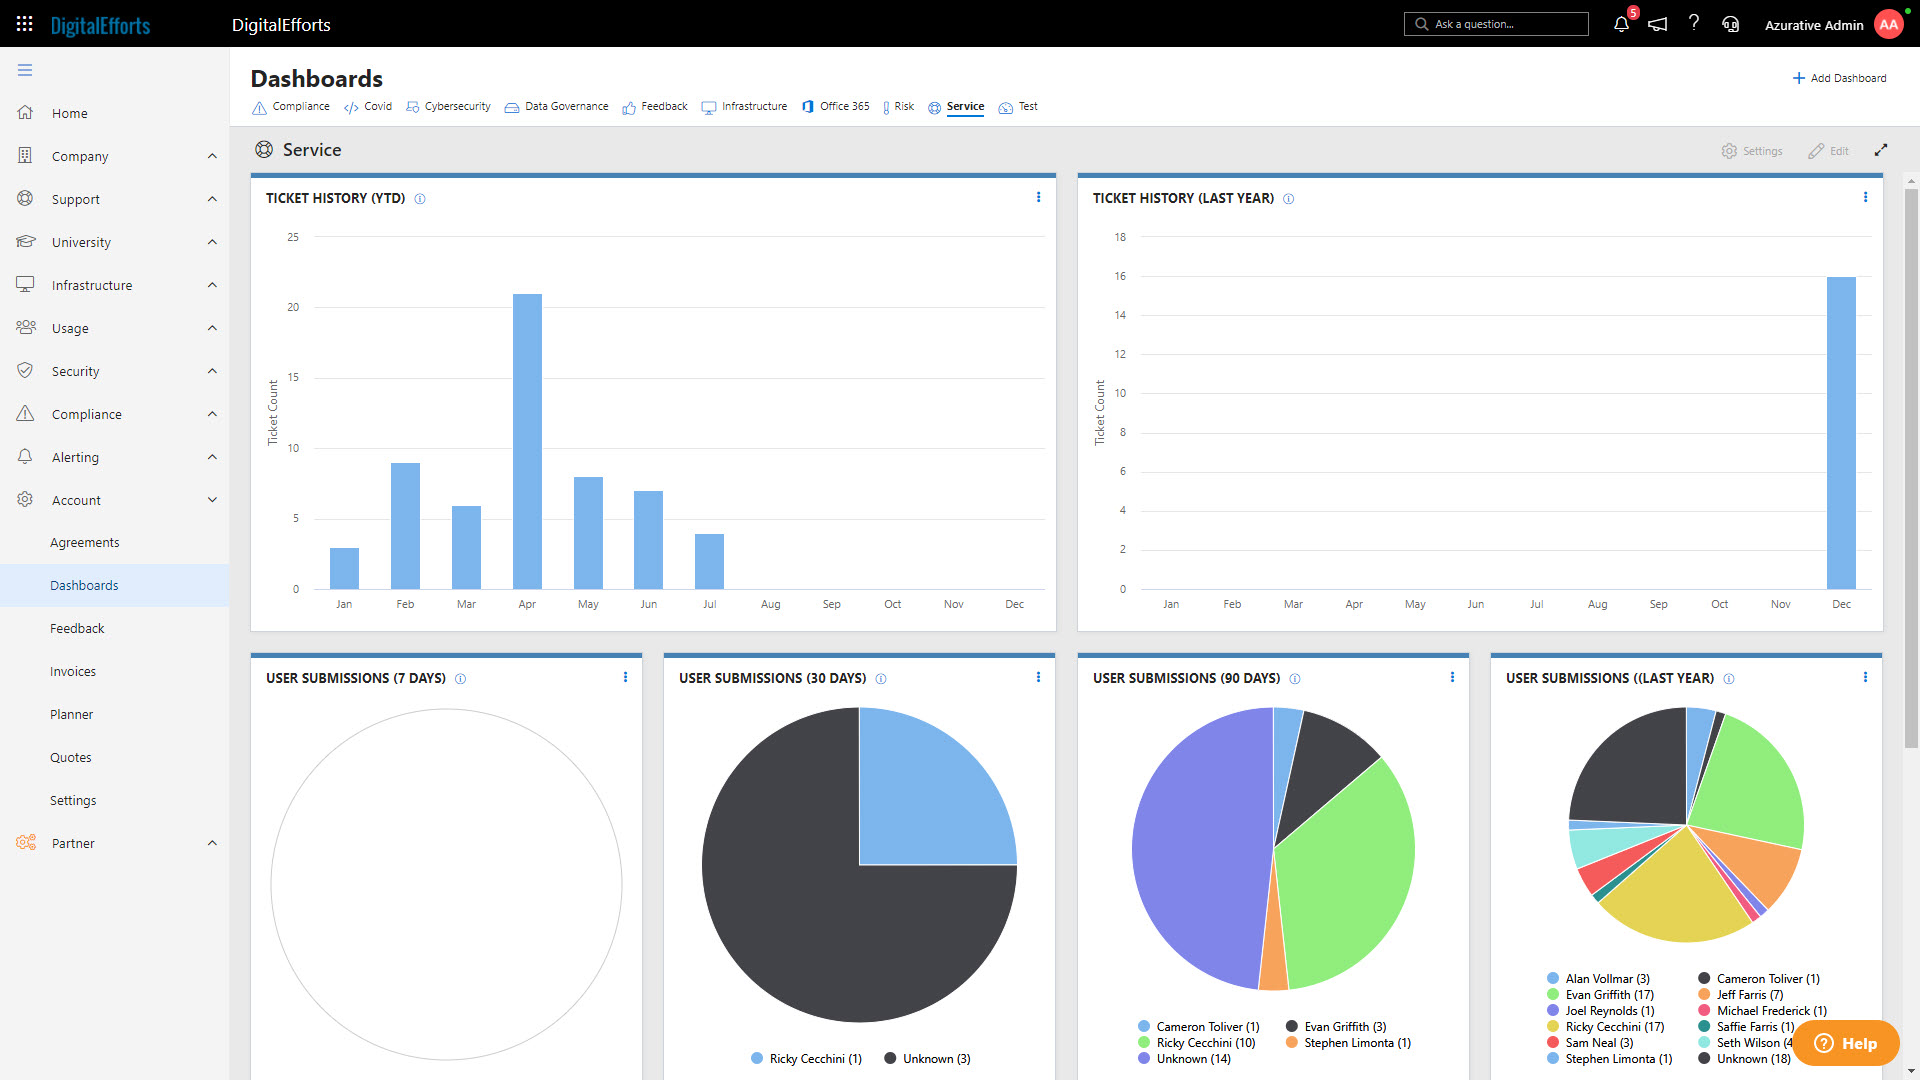
The solution to this problem? Turn the data visual through dashboards. And while you’re at it, put those dashboards in their client portal so that they can see it whenever they want.
Let’s run through the basics and best practices of data visualization in CloudRadial – and most importantly, what to actually do with the data you visualize.
Focusing on Actionable Data
Before deciding how to visualize the data, we must determine what’s worth sharing in the first place.
A lot of data that’s useful to the MSP internally may not matter to the client. To avoid oversharing and overloading clients with information, ask yourself this about the data you choose to share:
“Could this data require any action by us or the client?”
If the answer is no, then it doesn’t belong in your dashboard.
This is similar philosophy that aircraft manufacturers adhere to when designing an airplane cockpit – every gauge has an actionable purpose that pilots can use when appropriate to make corrections.
This concept of actionable data helps keep the information sprawl in dashboards to a minimum and usefulness of the information to a maximum.
Where Does the Actionable Dashboard Data Come From?
CloudRadial’s data-gathering agent pulls a lot of information in from endpoints and servers that fuels the build-in dashboard widgets. This information is key to starting conversations with the client about efficiency, compliance, security, and more.
Here are a few examples of information that you can visualize in dashboards with the CloudRadial agent:
- Disk encryption
- OneDrive usage
- Antivirus protection
- Patching status
- Password protection
- Screensaver protection
- Endpoint model
- Endpoint manufacturer
- Endpoint operating systems
- Endpoint warranty status
- Endpoint performance level
This information is easy to understand and, most importantly, easy to correlate with an action.
No encryption across the organization? It looks like it’s time for a security review.
Lacking passwords and screensaver protection? It could be a sign of compliance issues that need to be addressed sooner than later.
The native dashboards in CloudRadial don’t just rely on the agent, either.
You can also visualize data that comes from other sources, such as the PSA or Office 365. Connecting those adds dashboards that reflect things like ticket volume data, multi-factor authentication (MFA) status, email usage, and more.
Acting on these key pieces of data can lead to valuable conversations about deeper-rooted issues that can ultimately increase the monthly revenue from that client AND improve their overall business.
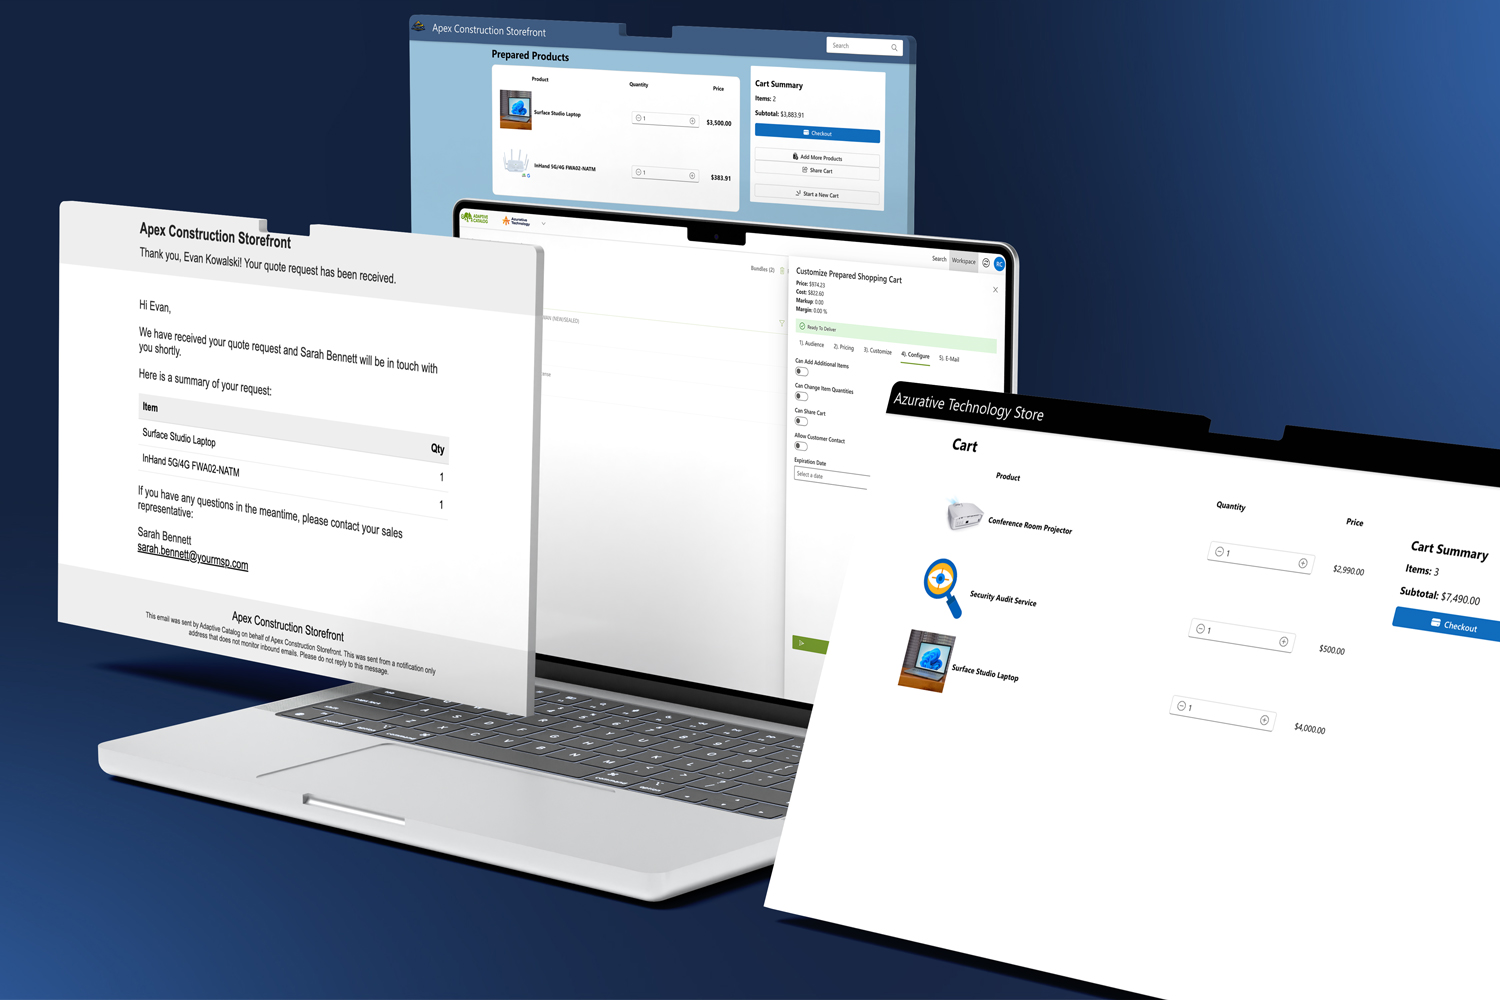
Integrating Third-Party Data into Dashboards
As a client portal, CloudRadial can capture plenty of valuable client data.
But not all the data that you want to leverage can be found in CloudRadial.
Let’s keep our concept of actionable data goal in mind, but let’s add one more caveat: the actionable data should be accessible by the MSP and client within as few areas as possible (ideally, just one).
What’s a better place to host it than directly in your client portal?
CloudRadial’s dashboards allow you to add in third-party data by way of the HTML widget. This lets you iframe in any data you want from any source that can transmit it over. We’ve had partners successfully leverage their data from tools like BrightGauge, Grafana, and PowerBI, and more.
More details: How to add 3rd party information in dashboards
Leveraging Visualized Dashboard Data in Business Review Meetings
Let’s say you’ve got a great dashboard going – the data is easy to understand, actionable, and varied to cover a wide spread of topics.
Now, all that’s left is to review the data with the client and decide what to do with it.
Many MSPs perform quarterly business review (QBR) meetings with their clients. When performing a QBR within CloudRadial, you’ve got the opportunity to review key pieces of client data without having to leave the portal – such as tickets, compliance policies, Office 365 information, and more.
Incorporating dashboards into the presentation mix is a great way to engage clients with visual information. Plus, if you’ve made the dashboard data actionable, you can also take it a step further and correlate your information gauges with your proposed account planner initiatives.
Unfamiliar with the CloudRadial planner? Get an overview here.
Using the “Add to Planner” functionality in the dashboard helps you explain your rationale for recommending additional services and solutions to your clients. The better you can explain your intentions, the higher the chance of the client signing up for more services with you.
Mastering Data Visualization in CloudRadial
If you need assistance with your dashboard strategy, you may want to consider a strategy session from CloudRadial’s expert team. We can help you set up your dashboards to scale for all your clients while incorporating them in a bigger reporting strategy overall.
Have a question or two in general? You can always reach out to support@cloudradial.com to get your bearings, too.
Now get out there and make some awesome dashboards!